The Ultimate Guide to Distributed Tracing: Monitor your Rails app using Opentelemetry, Jaeger and New Relic Agent
June 25, 2023 · 467 words · 3 min · opentelemetry gsoc
In this blog post we will learn how to instrument a Rails app using OpenTelemetry and send traces to Jaeger and New Relic simultaneously.
For additional information on OpenTelemetry, you can refer to my previous post.
Furthermore, basics are adequately covered in the OTEL docs
Without further ado, let’s dive right into it.
Installing Required Gems
Add these gems to your Gemfile
gem "opentelemetry-sdk"
gem "opentelemetry-exporter-otlp"
gem "opentelemetry-instrumentation-all"
Once added bundle install
Configuring the SDK
Here is a sample configuration to get started with configuring the SDK. Initially, I have manually instrumented only
the necessary parts. However, this process can also be replaced by using c.use_all for simplification.
config/initializers/opentelemetry.rb
# frozen_string_literal: true

require "opentelemetry/sdk"
require "opentelemetry/exporter/otlp"
require "opentelemetry/instrumentation/all"

OpenTelemetry::SDK.configure do |c|
  c.service_name = "CircuitVerse" # Service Name
  c.use "OpenTelemetry::Instrumentation::Rails"
  c.use "OpenTelemetry::Instrumentation::ActiveSupport"
  c.use "OpenTelemetry::Instrumentation::Rack"
  c.use "OpenTelemetry::Instrumentation::ActionPack"
  c.use "OpenTelemetry::Instrumentation::ActiveJob"
  c.use "OpenTelemetry::Instrumentation::ActionView"
  c.use "OpenTelemetry::Instrumentation::ActiveRecord"
  c.use "OpenTelemetry::Instrumentation::AwsSdk"
  c.use "OpenTelemetry::Instrumentation::HTTP"
  c.use "OpenTelemetry::Instrumentation::ConcurrentRuby"
  c.use "OpenTelemetry::Instrumentation::Faraday"
  c.use "OpenTelemetry::Instrumentation::Net::HTTP"
  c.use "OpenTelemetry::Instrumentation::PG"
  c.use "OpenTelemetry::Instrumentation::Redis"
  # or use use_all
  # c.use_all
end
Setting up Collector, Exporter
Create a new directory named .otel (mkdir .otel) in the root of your rails app and then add following files there..
Exporting New Relic Api key
export NEW_RELIC_API_KEY=<api-key-here>
.otel/docker-compose.yaml
version: "3"
services:

  jaeger-all-in-one:
    image: jaegertracing/all-in-one:latest
    environment:
      - COLLECTOR_ZIPKIN_HOST_PORT=:9411
      - COLLECTOR_OTLP_ENABLED=true
    ports:
      - "16686:16686"
      - "14268"
      - "14250"

  otel-collector:
    image: otel/opentelemetry-collector-contrib
    command: ["--config=/etc/otel-collector-config.yaml", "${OTELCOL_ARGS}"]
    volumes:
      - ./otel-collector-config.yaml:/etc/otel-collector-config.yaml:ro
    ports:
      - "4318:4318"
	  - "13133:13133"   # health check
    depends_on:
      - jaeger-all-in-one
New Relic OpenTelemetry best practices:
Exporting New Relic Api key
We need to setup an environment variable (either using .env or adding to your shell profile) to pass the New Relic API key as header in order to be able to send traces to the New Relic endpoint.
export NEW_RELIC_API_KEY=<api-key-here>
Confirming New Relic Data Center
If your data center for New Relic Agent is US then the configuration is same as below. Else you need the otlp endpoint to your data Center
For more info refer here
EU endpoint
otlp:
  endpoint: https://otlp.eu01.nr-data.net:4318
  headers:
	"api-key": $NEW_RELIC_API_KEY
.otel/otel-collector-config.yaml
extensions:
  health_check: {}

receivers:
  otlp:
    protocols:
      http:

processors:
  batch:
  transform:
    trace_statements:
      - context: span
        statements:
          - truncate_all(attributes, 4095)
          - truncate_all(resource.attributes, 4095)

exporters:
  logging:

  jaeger:
    endpoint: jaeger-all-in-one:14250
    tls:
      insecure: true

  otlp:
    endpoint: https://otlp.nr-data.net:4318
    headers:
      "api-key": $NEW_RELIC_API_KEY

service:
  pipelines:
    traces:
      receivers: [otlp]
      processors: [transform, batch]
      exporters: [logging, jaeger, otlp]
Starting Server
Following command will start 2 containers:
- Jaeger (all-in-one): Jaeger’s all in one image that includes the exporter, collector and the Jaeger UI component.
- Opentelemetry collector: For exporting data to New Relic Agent.
cd .otel

docker compose up -d
Results
After starting the containers start your Rails app and make some basic requests and then traces will appear in both Jaeger and New Relic.
Then Navigate to
-
Jaeger UI dashboard: http://localhost:16686
-
New Relic dashboard: https://one.newrelic.com/distributed-tracing
in order to see traces.
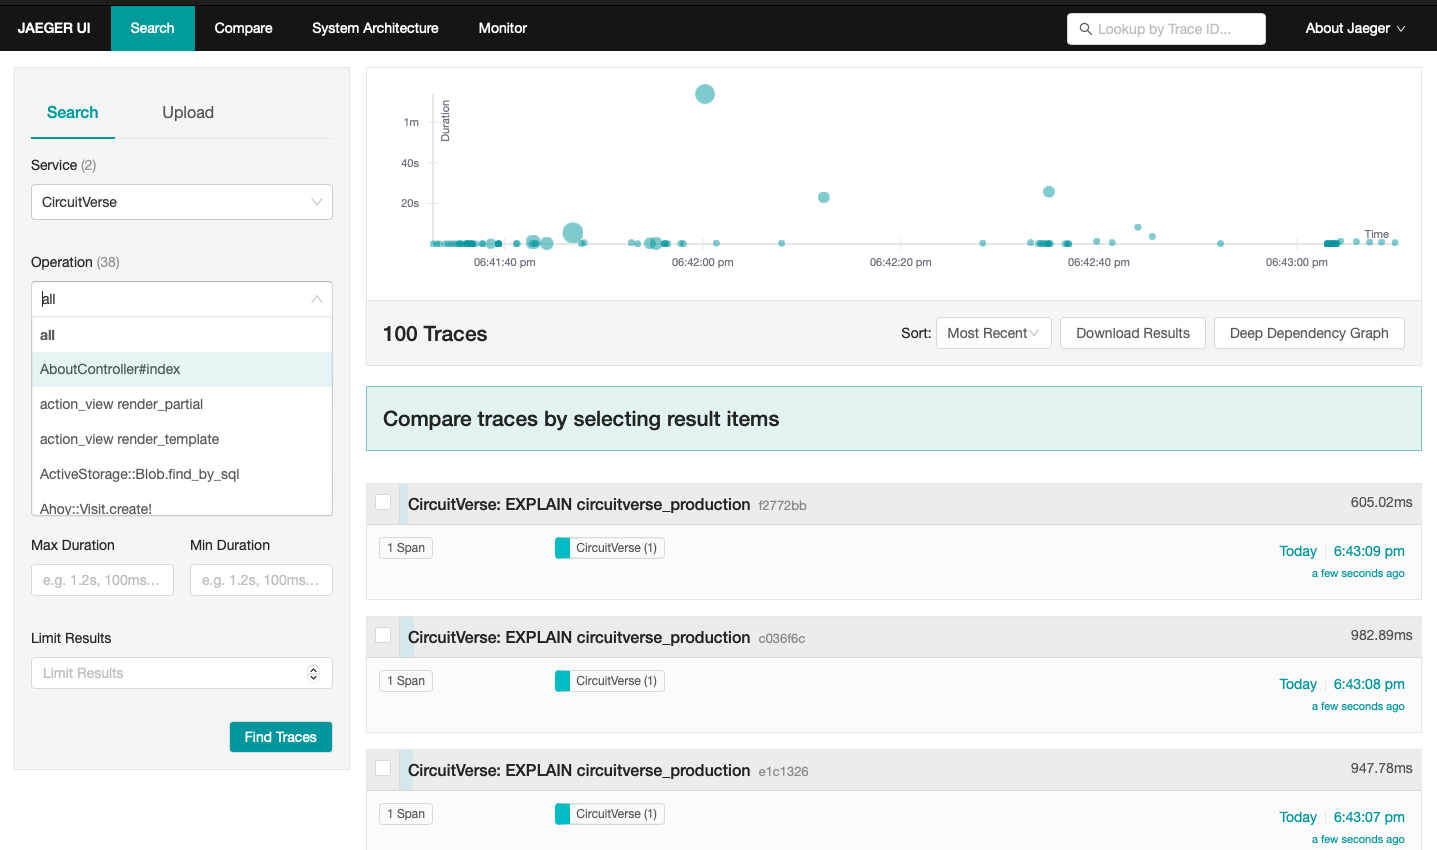
Jaeger Dashboard:

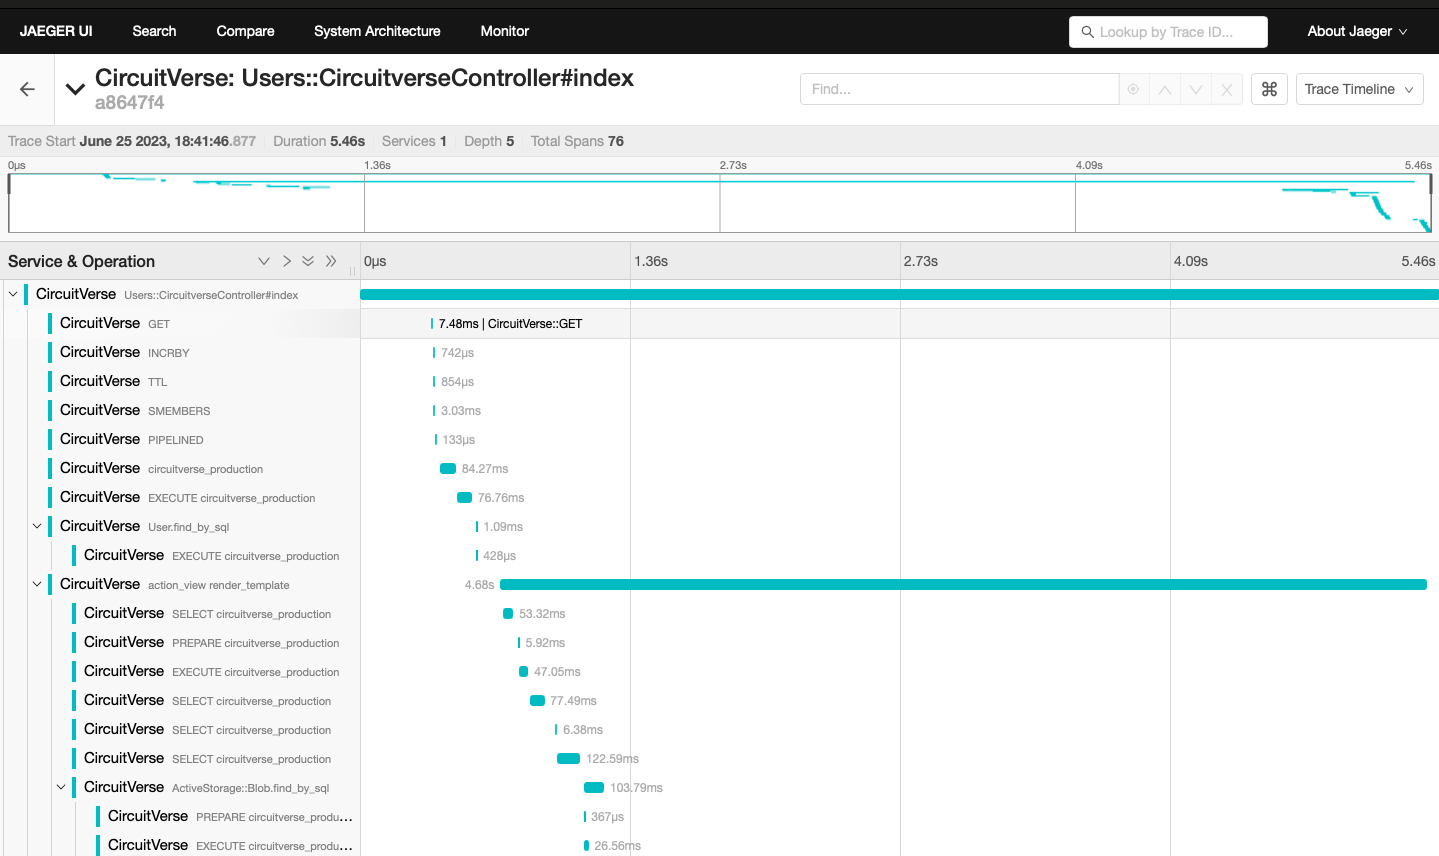
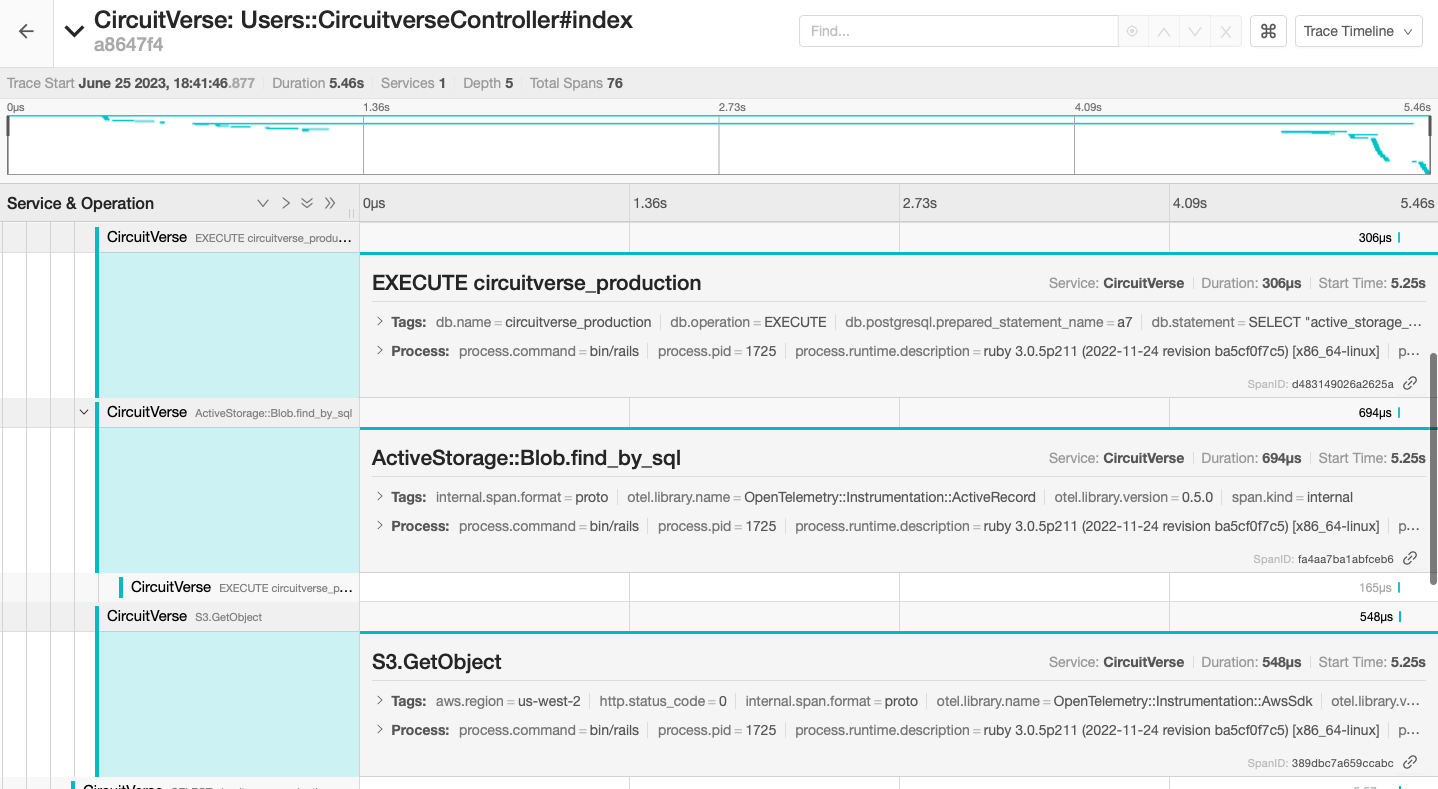
Jaeger Single Trace


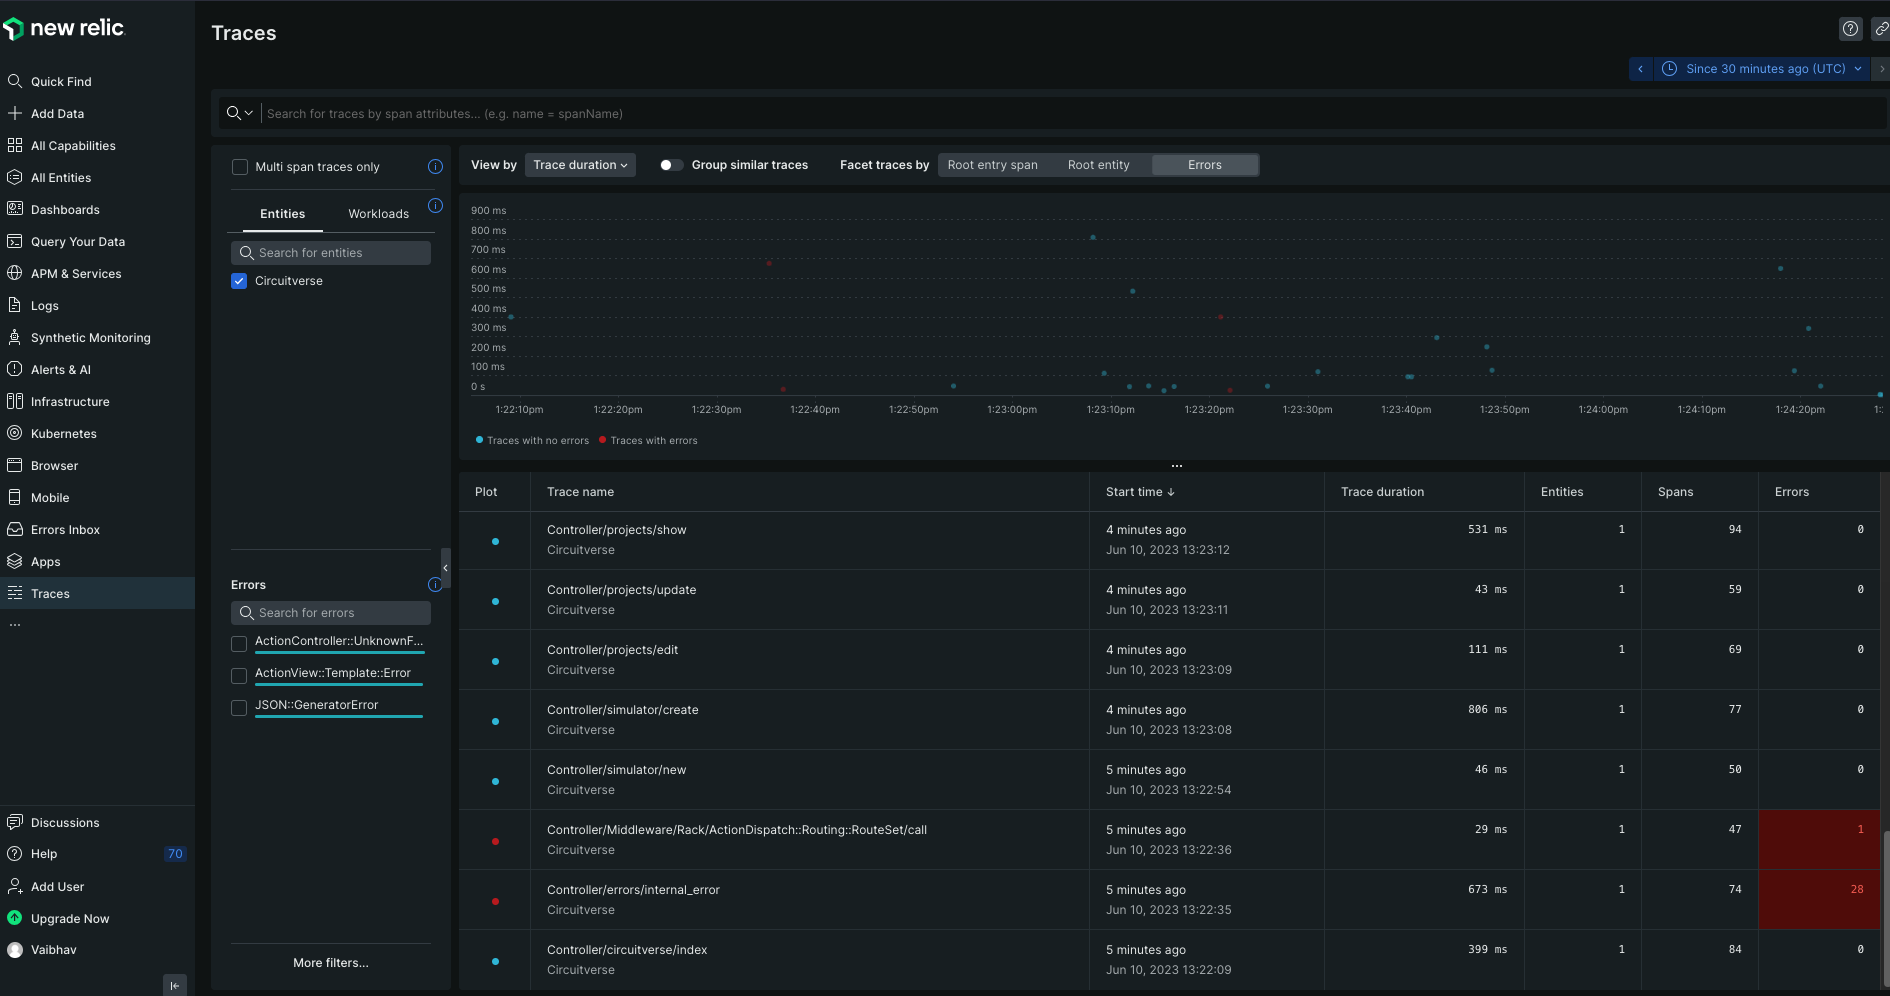
New Relic Dashboard:
